Guest post by Donald R. Prothero

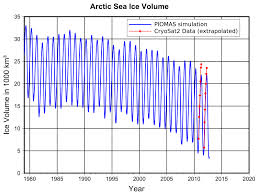
The rapid disappearance of the Arctic sea ice, with an averaged curve (black line) fitted to the annual cyclic variation of seasonal ice (fluctuating blue curve).
The year 2012 and now early 2013 have been an unending litany of bad climate news. After a record-breaking year of heat and drought in North America, followed up by devastating Superstorm Sandy, and record heat and fires in Australia, the year 2012 ended up being the ninth hottest year on record despite a strong La Niña cycle that should have made it a lot cooler. Once the current La Niña cycle ends, you can expect the next few years to blast past the previous global temperature record of 2010. As it is, nine of the ten hottest years on record were in the last decade—only the record-breaking El Niño year of 1998 didn’t occur in the window between 2002 and 2012.
Even more alarming were the weekly reports about the incredibly fast loss of our global ice volume, from mountain glaciers to the Greenland and Antarctic continental ice sheets. Most serious of all, however, is the record melting of the Arctic ice. Last summer, the Arctic ice cap shrank to the lowest level ever measured, and even the winter ice pack was the fifth smallest ever measured. And we recently learned that the melting rate of the Antarctic ice cap is the highest ever recorded. If anything will cause the rapid rise of sea level, it will be the melting of these ice sheets. Then we’ll see not only low-lying countries disappear, but more storms like Superstorm Sandy, whose storm surge will reach much further inland with a higher sea level base.
Deniers pointed to the heavy snowstorms that hit North America in late winter and even the spring of 2013, and foolishly made jokes about global warming as they stood in the snow. Once again, they are confusing weather (the rapidly fluctuating changes in temperature and precipitation on a daily or weekly time scale) with climate (the long-term average of weather over years to decades or longer). Ironically, the late-winter blizzards are actually a prediction of the climate models: late winter storms are due to the increasing moisture that builds up in the atmosphere in a warming planet, especially because the Arctic is warming up, adding moisture to the system, and affecting climate in new ways. As Greg Laden explains, the new air currents triggered by the ice-free Arctic Ocean are like a hole between the freezer on top and the refrigerator below. The cold leaks downward more often, forming late snowstorms in North America, while the freezer itself (the Arctic) doesn’t get as cold as it’s supposed to.
Over and over again, we hear the climate deniers making the claim that the warming is “just part of a natural cycle,” and can’t be blamed on humans or our huge output of greenhouse gases. The best way to debunk that argument is to look at past climate records to see if the present-day warming is within normal variability. The most important recent study to examine the problem was the famous “hockey stick” paper of Dr. Michael Mann and his colleagues. First published in 1998, and frequently revised, it has been the focus of climate deniers trying to discount its serious implications. They have attacked not only the paper itself, but grandstanding right-wing demagogues like Virginia’s Attorney General Ken Cuccinelli have tried to prosecute Mann in a great witch hunt (since dismissed in court as frivolous—and Mann is now at Penn State, so Cuccinelli can’t reach him). Mann has received numerous death threats for being a Cassandra bearing bad news (as he describes in his scary and unsettling book The Hockey Stick and the Climate Wars).

The Mann et al. (1998) “hockey stick” graph, showing the relatively steady climate of the past 1000 years, and the anomalously fast rise of temperatures in the last 150 years.
The chief legitimate scientific criticism about the original “hockey stick” paper (so-called because it shows climate as nearly a straight trend through the past 1000 years, culminating in a sharp bend upward in the past 200 years, like the blade of a hockey stick) was that Mann and colleagues generated a composite curve of actual observed global temperatures (the last 150 years or so), with older records from tree rings, ice cores, and a few other data sources. Since all these recorders measure global temperature differently, it is always a challenge to calibrate them properly so they yield a single consistent climate curve. However, NONE of these attacks on the data of Mann et al. (1998) contradict the fact that the sharp rise in temperatures in the past 200 years is real, or that it is much more rapid than any climate change we could detect from these data sources over the previous 1000 years.

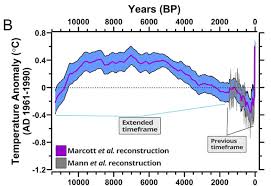
The new Marcott et al. (2013) expands the record way past the original data (shown on right), and clearly demonstrates that the past 150 years are NOT within normal variability during the entire past 11,300 years.
But all those criticisms of Mann et al. (1998) are now moot. A new study by Shaun Marcott, Jeremy Shakun, Peter Clark, and Alan Mix of Oregon State University and Harvard (Alan was a classmate of mine when I studied paleoclimate at Lamont-Doherty Geological Observatory) has circumvented most of the objections to the original “hockey stick.” This study goes back 11,300 years with +/- 300 year resolution (the highest ever), through the entire Holocene interglacial, expanding the record much earlier than the 1000- to 2000-year records of older studies. Most of this older record comes from the isotopes of plankton in deep-sea cores, one of the oldest and best established methods of paleoclimatic temperature estimates. Most importantly, it comes primarily from this data source, and so is not hampered by the criticisms of compiling widely different data sources, the problem that plagued the original “hockey stick” curves. What it clearly demonstrates is that the warming of the past 150 years is not only hotter than at any time in the past 11,000 years, but it is MUCH faster as well, and NOT proceeding at the typical rates of global cooling and warming in the past when humans were not filling the atmosphere with greenhouse gases. If ever there was a smoking gun that we are responsible for global warming, this is it (along with many other lines of evidence that I have outlined in previous posts).
Still not satisfied? Then let’s expand it back to 20,000 years through the past glacial! The curve of the present Holocene interglacial of Marcott et al. (2012) can be added to data going back to the peak of the last glacial at 20,000 years ago to give a curve that is being nicknamed “The Wheelchair” (Shakun et al., 2012). Now we have 20,000 years of record to examine, the anomalously rapid heating of the past 150 years (the vertical line that forms the “back” of the “wheelchair”) really stands out as extreme and unnatural.

The EPICA-1 ice cores from Antarctica showed that at no time in the past 680,000 years has carbon dioxide been above 300 ppm–yet it is almost 400 ppm today.
STILL not convinced? Then we will go even further back in time, to the EPICA-1 ice cores in Antarctica (Siegenthaler et al., 2005), which drilled back over 680,000 years into the past. This core recovered air samples from trapped gas bubbles that gives us an isotopic and carbon dioxide record through the past 6 or 7 glacial-interglacial cycles (each lasting about 110,000 years, and due to the Milankovitch orbital eccentricity cycle that has been well known for decades). As these records show, at no time during any of the previous interglacial cycles did the atmospheric carbon dioxide level exceed 300 ppm, even at the warmest part—yet our planet is well above 350 ppm today, and shooting rapidly to 400 ppm in a few years and possibly to 600 ppm before the end of the century. THAT is not natural “climate variability” by any stretch of the imagination!
The voices of climate denialism, fueled by funding from the energy industries whose mission is to confuse us with smokescreens of doubt, will keep attacking these data and trying to obscure what these plots tell us. For the longest time, it seemed that their PR was winning over scientific truth. But recent polls seem to show the balance of public opinion changing the other way. A poll taken just after the 2012 election showed that 68% of Americans now regard climate change as a “serious problem,” up from only 48% in 2011, and 46% in 2009. A few weeks later, another poll found that 80% of Americans accept that climate is changing (compared to 73% in 2009), and 57% say the U.S. government should do something about it. And the most recent poll found that even a majority of GOP voters accept that climate change is real and that the government should do something about it (even if their leaders are still climate deniers)!
The times, they are a changin’ . . .
Donald R. Prothero is the winner of the 2013 National Association of Geoscience Teachers’ James Shea Award and the author, coauthor, editor, or coeditor of 28 books, including three JHU Press titles, Catastrophes! Earthquakes, Tsunamis, Tornadoes, and Other Earth-Shattering Disasters, The Evolution of Artiodactyls, and Horns, Tusks, and Flippers: The Evolution of Hoofed Mammals. He is on the editorial board of Skeptic magazine, and in the past has served as an associate or technical editor for Geology, Paleobiology, and Journal of Paleontology. Professor Prothero is a Fellow of the Geological Society of America, the Paleontological Society, and the Linnaean Society of London. This post originally appeared at Skepticblog, where he blogs regularly.
